WEST BENGAL
Industry Revival
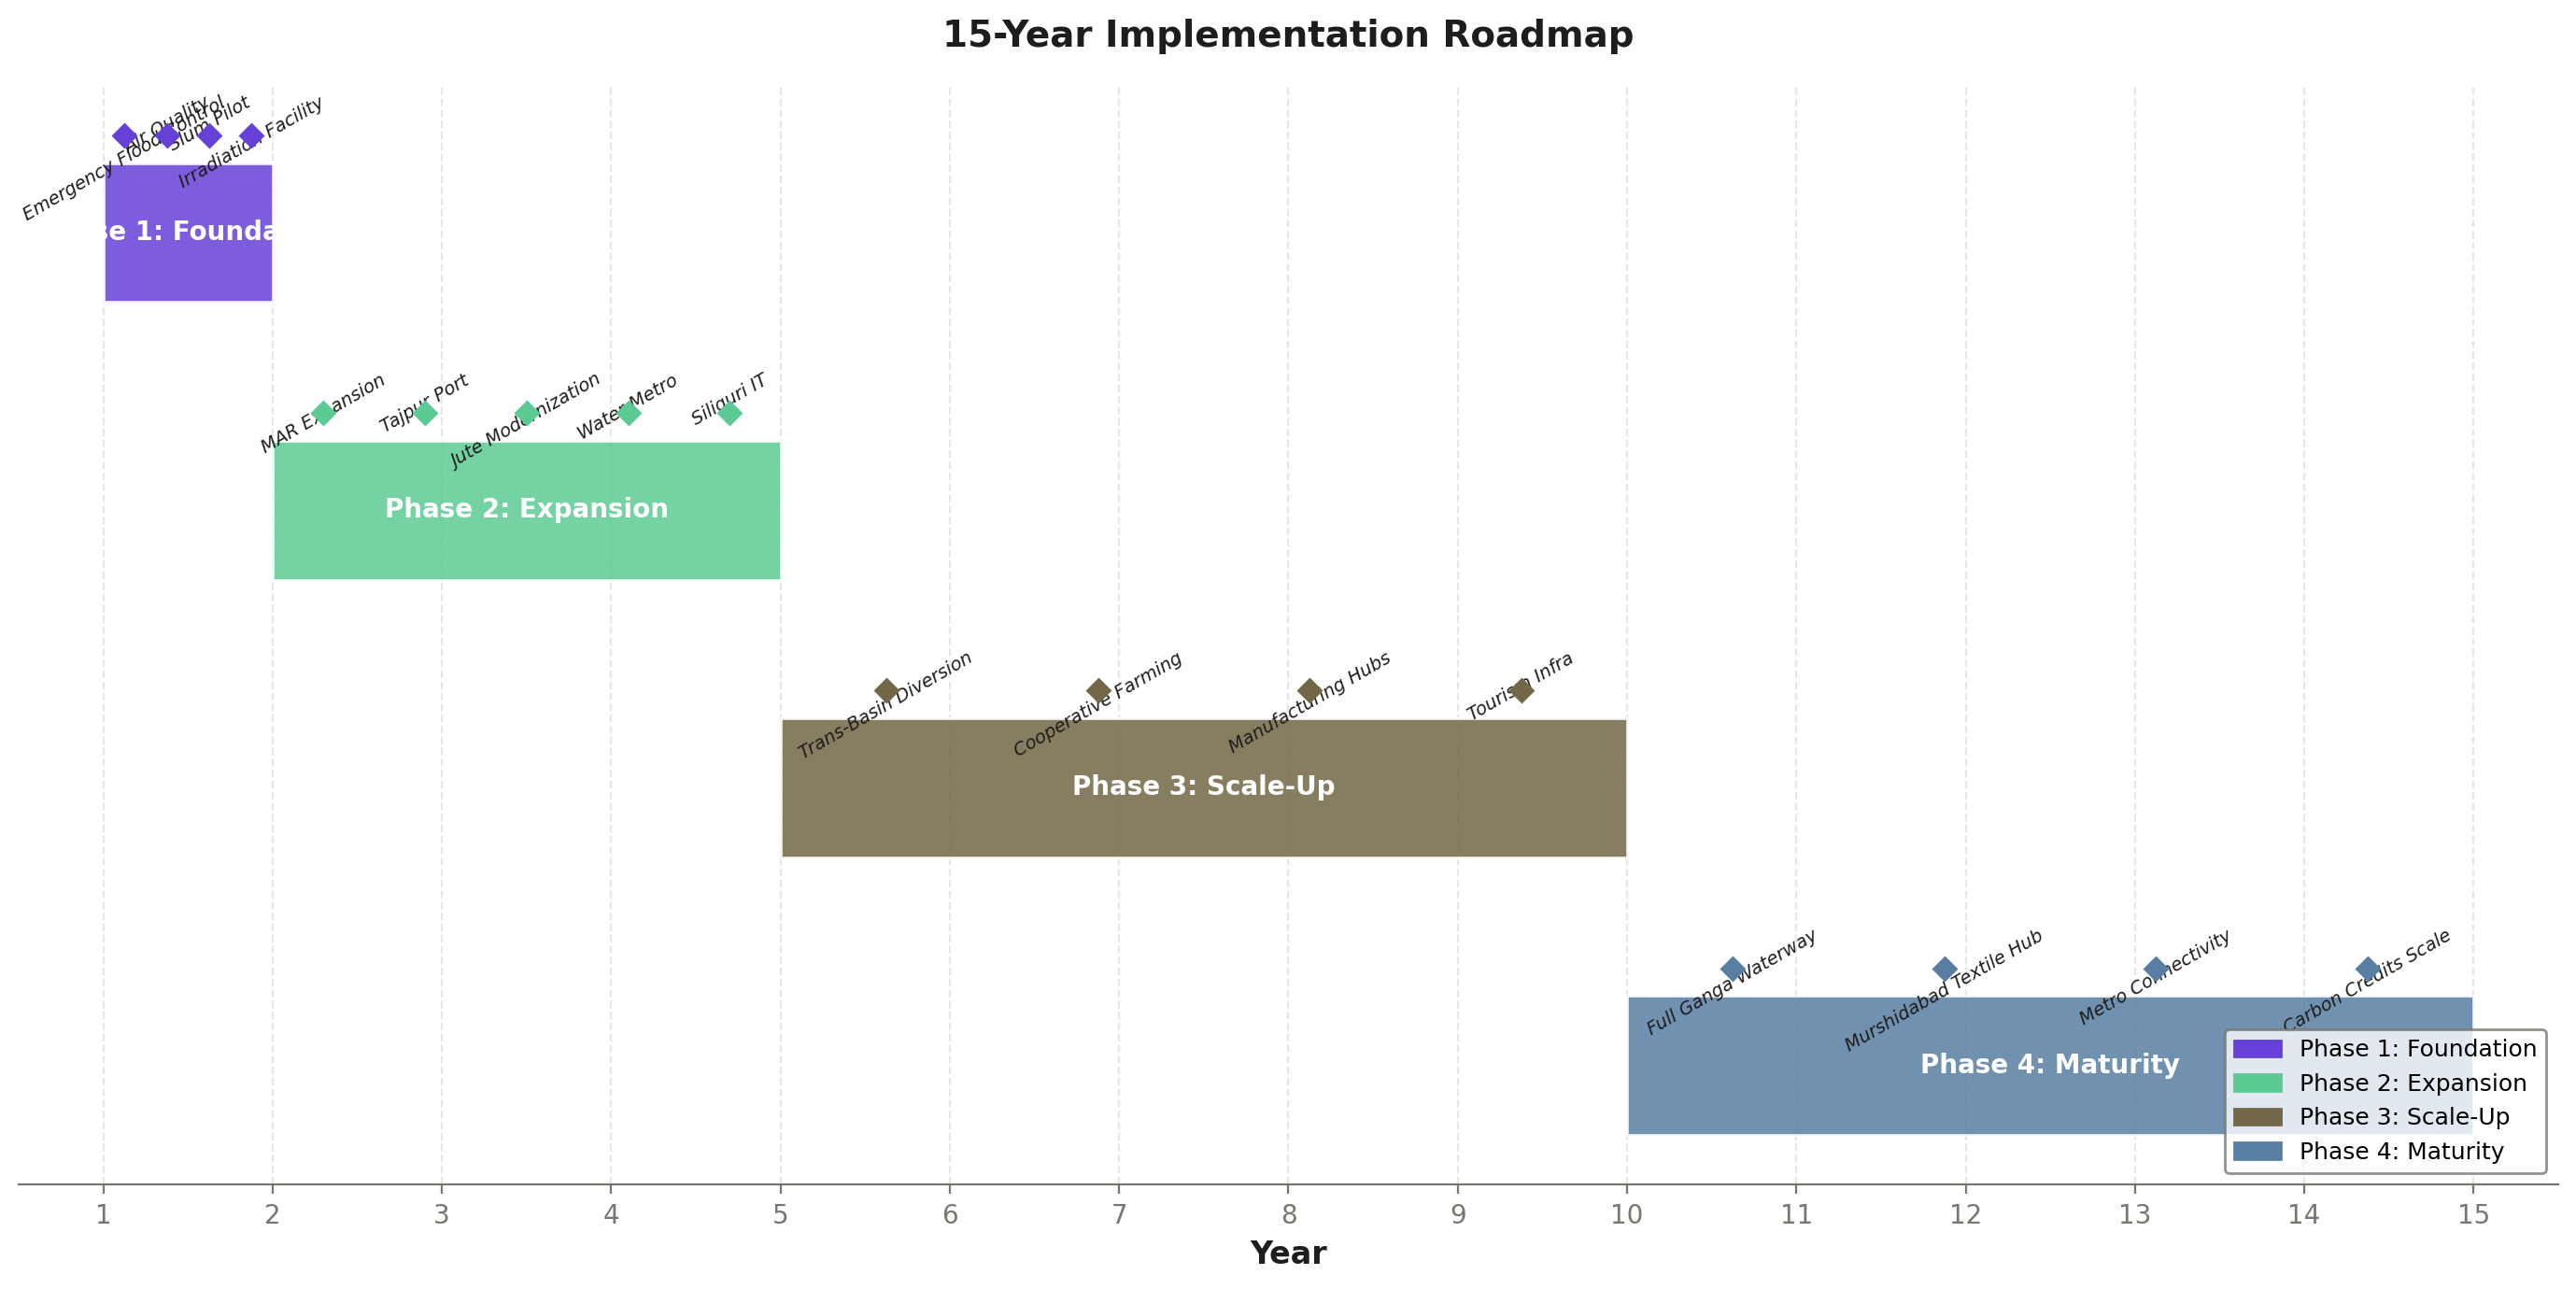
Master Plan
A Comprehensive 15-Year Strategy for Economic Transformation
What Will Be Implemented
The seven strategic pillars will transform West Bengal's economy across every major sector. Here's what each pillar delivers:
Water Infrastructure
₹45,000 Cr irrigation & flood control for North Bengal, ₹20,000 Cr drinking water under Jal Jeevan Mission, 5 GW floating solar programme, NW-1 waterway upgrade to 30–40 MMT cargo capacity
Agriculture & Food
5 lakh tonnes shrimp/year farming, 10 mega food parks, 50 integrated cold chains, fish processing parks at Digha & Diamond Harbour, gamma irradiation facilities
Industrial Revival
Deocha-Pachami mining (2,100 MT reserves, 85–140 year operations), steel cluster at Raghunathpur, chemicals at Haldia, leather complex expansion, 90 lakh MSMEs uplift
Urban Transformation
Metro & RRTS network (~200 km), 150 km BRT across Tier-2 cities, East-West metro corridor completion, smart city for 50 ULBs, affordable housing under PMAY-U
Connectivity & Transport
Tajpur deep-draft port (30–40 MMT capacity), 3,000 km new expressway & highway, Kolkata–Siliguri corridor (6–8 hrs), dedicated freight corridor connectivity
Tourism
Durga Puja expansion (₹32,000–50,000 Cr economy), Ganga river cruises Kolkata–Varanasi, Sundarbans eco-tourism with elevated eco-lodges, marine aquarium at Digha
Environment & Sustainability
5,000 electric buses, 3 GW solar in Purulia–Bankura, 500 MW wind in Purba Medinipur, EKW restoration (₹500 Cr), 20,000 ha afforestation, BS-VI transition
The Seven Pillars of Transformation
A coordinated investment strategy across seven interconnected pillars to accelerate West Bengal's economic growth by 2.5–3.5 percentage points annually.
Investment Allocation by Pillar
Executive Summary
West Bengal, with a population of approximately 105 million and a current GSDP (2024-25) of ₹18.8 lakh crore, stands at a pivotal juncture. The state possesses remarkable assets—the Sundarbans, rich agricultural land, a deep industrial heritage, and strategic access to Southeast Asian markets via the Bay of Bengal. Yet growth has lagged the national average for over two decades. This Master Plan proposes a coordinated ₹2,20,000 crore investment across seven strategic pillars to add 2.5–3.5 percentage points to the state's annual real growth rate over a 15-year horizon.
A critical framing note: at 6% real growth, West Bengal's GSDP would double roughly every 12 years even without any intervention. The plan does not claim to "double" the economy; rather, it targets a structural acceleration that would add ₹18–32 lakh crore in annual GSDP above the baseline by Year 15, representing a 23–40% increment over the no-plan scenario.
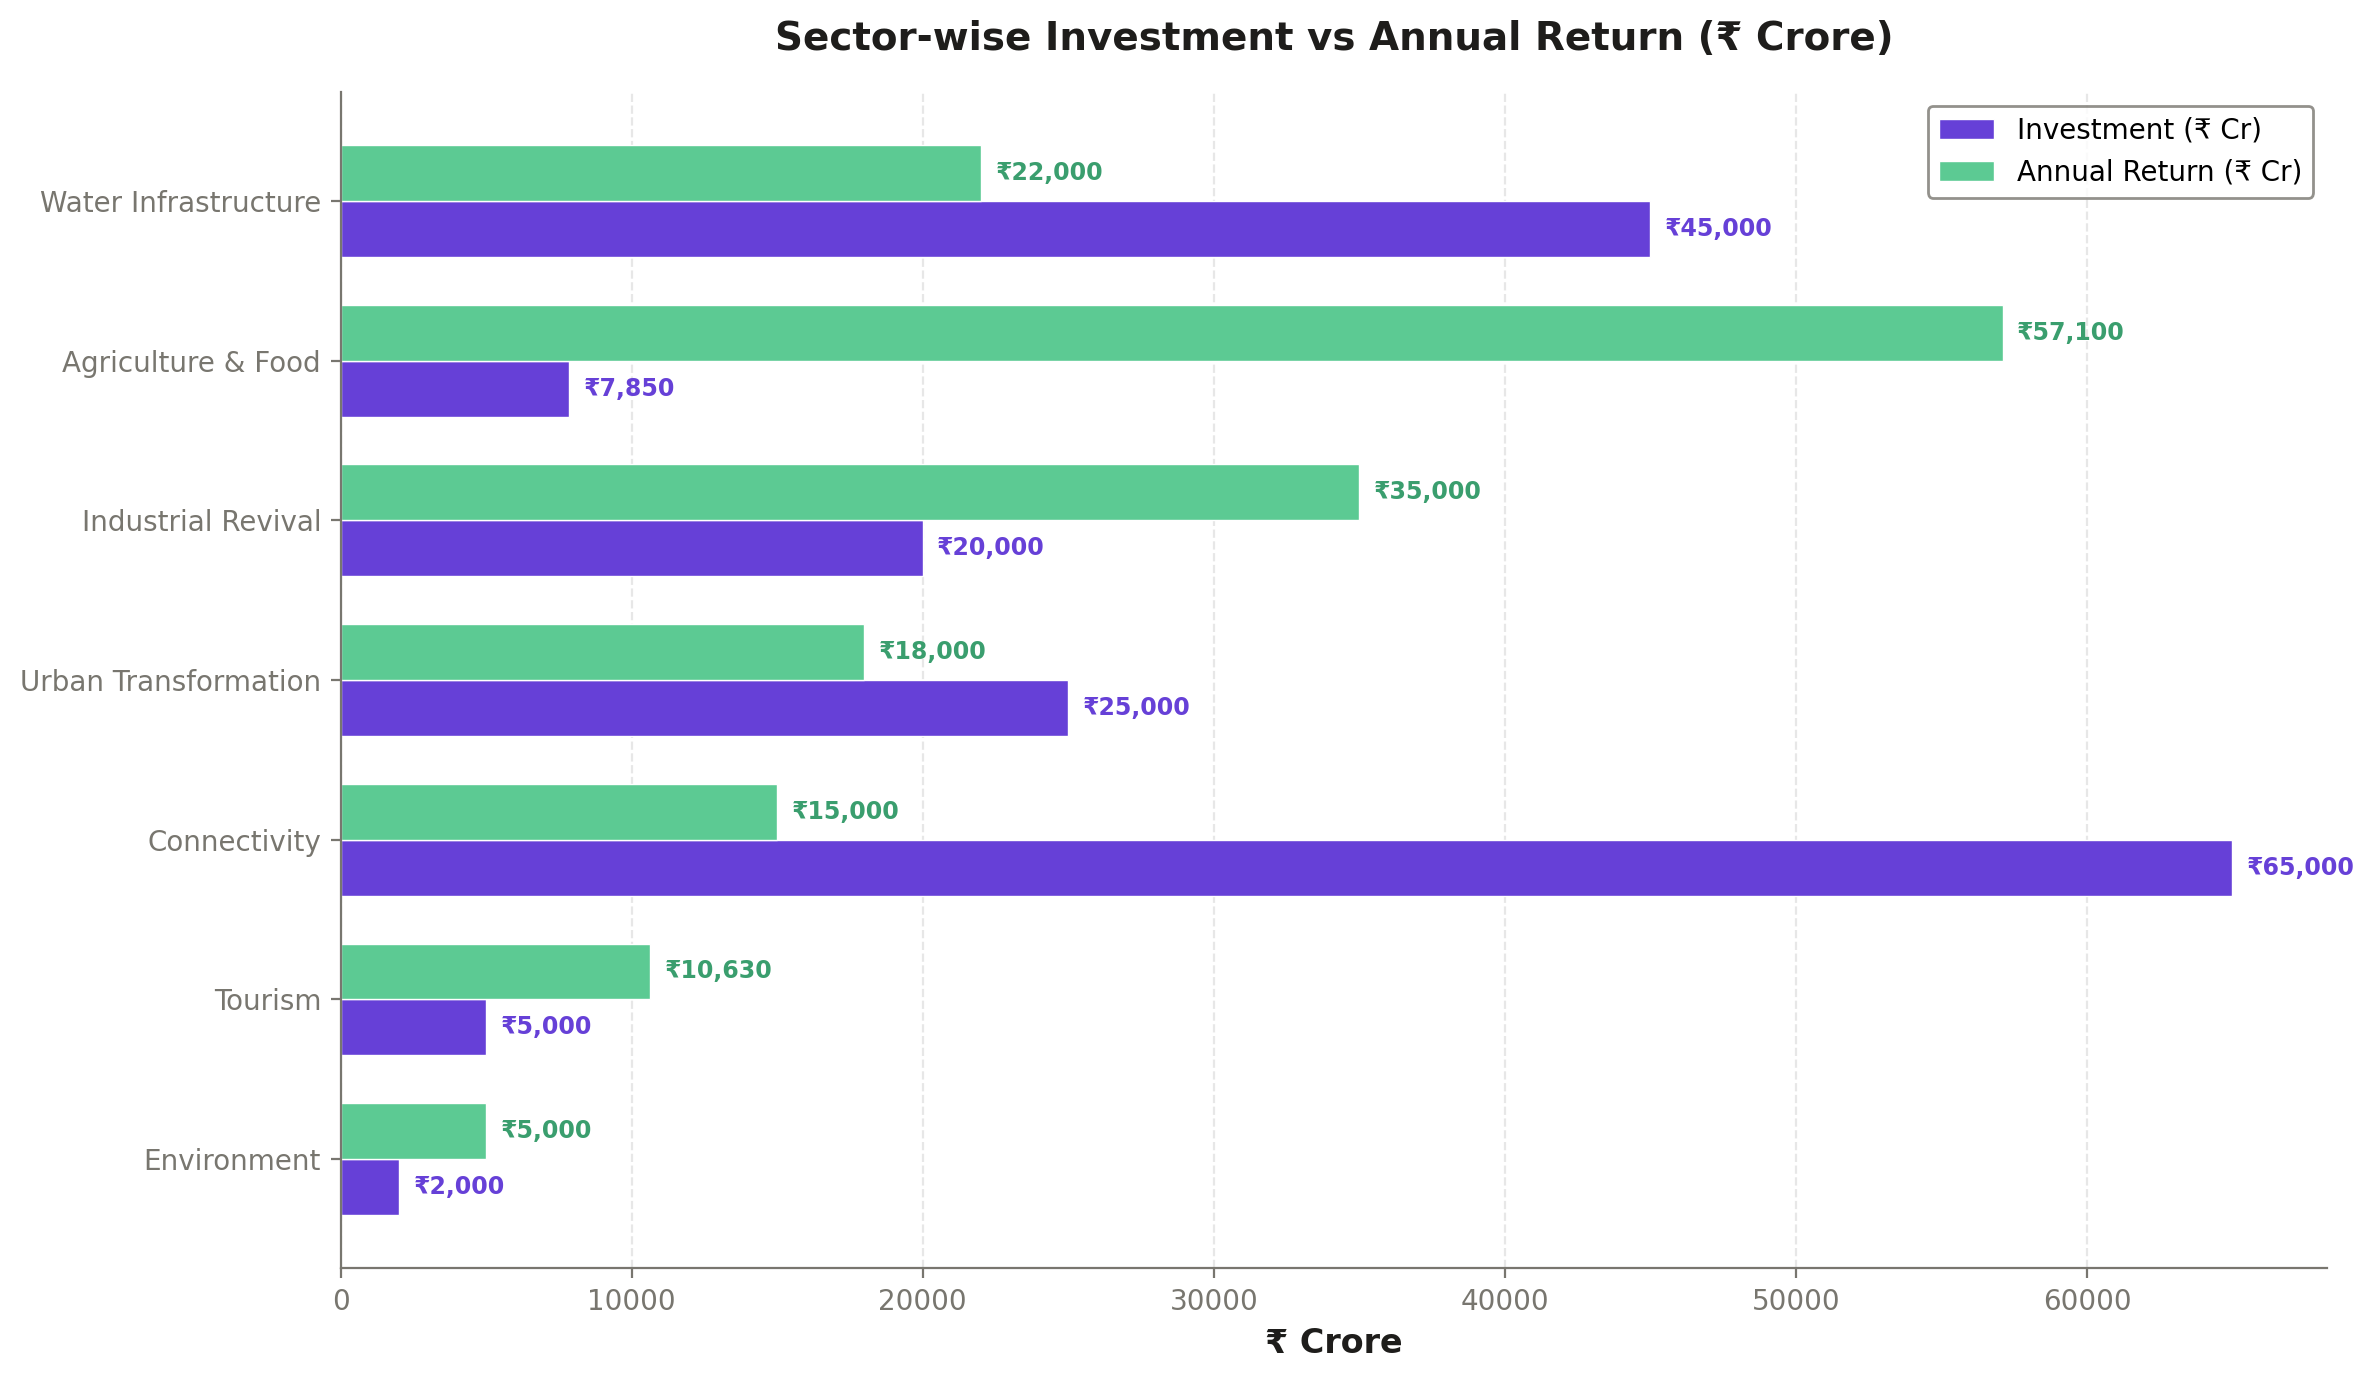
Investment Overview
| Pillar | Total Investment | State Share | Annual Value Added (at Maturity) |
|---|---|---|---|
| 1. Water Infrastructure | 75,000 Cr | 9,000–11,000 Cr | 8,000–12,000 Cr/yr |
| 2. Agriculture & Food | 8,000 Cr | 2,500–3,500 Cr | 10,000–18,000 Cr/yr |
| 3. Industrial Revival | 25,000 Cr | 5,000–7,000 Cr | 12,000–22,000 Cr/yr |
| 4. Urban Transformation | 22,000 Cr | 8,000–11,000 Cr | 3,000–8,000 Cr/yr |
| 5. Connectivity & Transport | 80,000 Cr | 20,000–28,000 Cr | 3,500–6,000 Cr/yr |
| 6. Tourism | 7,000 Cr | 2,000–3,000 Cr | 4,500–7,300 Cr/yr |
| 7. Environment | 3,000 Cr | 800–1,200 Cr | 500–1,500 Cr/yr |
| TOTAL | 2,20,000 Cr | 47,300–63,700 Cr | 41,500–74,800 Cr/yr |
Three Growth Scenarios
Rather than presenting a single point estimate, this plan models three scenarios: Conservative (7.5% real growth), Moderate (8.5%), and Aggressive (9.5%), compared to the baseline of 6% without intervention.
Key Principles
Value Added, Not Turnover
All return figures represent GDP value added, not gross turnover. Government revenue, GDP contribution, and economic surplus (avoided costs) are reported separately.
No Double-Counting
The 'domination sectors' analysis (Section 11) represents the same economy viewed through a sectoral lens—not additional returns on top of pillar investments.
Honest Risk Assessment
Implementation delays of 3–7 years are typical for Indian infrastructure. The Conservative scenario accounts for partial delivery.
Three Scenarios
Every projection includes Conservative, Moderate, and Aggressive cases.
State Share Honesty
The state government's actual contribution is 25–35% of total investment, not 15–25% as sometimes claimed, when central scheme matching and debt obligations are included.
Current Economic Landscape
2.1 Demographic & Economic Profile
West Bengal is home to approximately 105 million people (not 106 million as sometimes cited), making it the fourth most populous state in India. The state's GSDP for 2024-25 stands at ₹18.8 lakh crore—significantly lower than the ₹21.5 lakh crore figure sometimes used, which includes inflation-adjusted nominal estimates that conflate real and nominal growth.
The state's real growth rate has averaged approximately 5.5–6.0% over the past decade, below the national average of 6.5–7.0%. Key structural challenges include: declining manufacturing share (from 22% of GSDP in 2005 to approximately 14% today), underutilized port, chronic flooding in North Bengal, and urban congestion in the Kolkata Metropolitan Area.
2.2 Key Sectors at a Glance
Sector Contribution to GSDP
| Sector | Contribution | Key Challenge |
|---|---|---|
| Agriculture | ~18% of GSDP | Low productivity, 40% rainfed |
| Manufacturing | ~14% of GSDP | Declining share, outdated plants |
| Services | ~55% of GSDP | Informal sector dominance |
| Mining | ~3% of GSDP | Underdeveloped, Deocha-Pachami potential |
| Construction | ~10% of GSDP | Cyclical, skill gaps |
2.3 Infrastructure Deficit
West Bengal's infrastructure gap is both a challenge and an opportunity. The state has only 2.4 km of national highway per 100 km² (vs 4.1 for the national average). Inland waterway NW-1 currently carries 16.4 MMT of cargo (not 25 MMT as sometimes cited). The Kolkata Metropolitan Area faces chronic waterlogging, with the East Kolkata Wetlands (EKW) treating only 30–60% of the city's sewage (not 80% as often claimed).
The Deocha-Pachami coal block holds approximately 2,100–2,170 MT of reserves (not the inflated figure of up to 5,000 MT sometimes reported). While this is still substantial, honest assessment of the resource base is essential for realistic planning.
Water Infrastructure
3.1 Irrigation & Flood Control
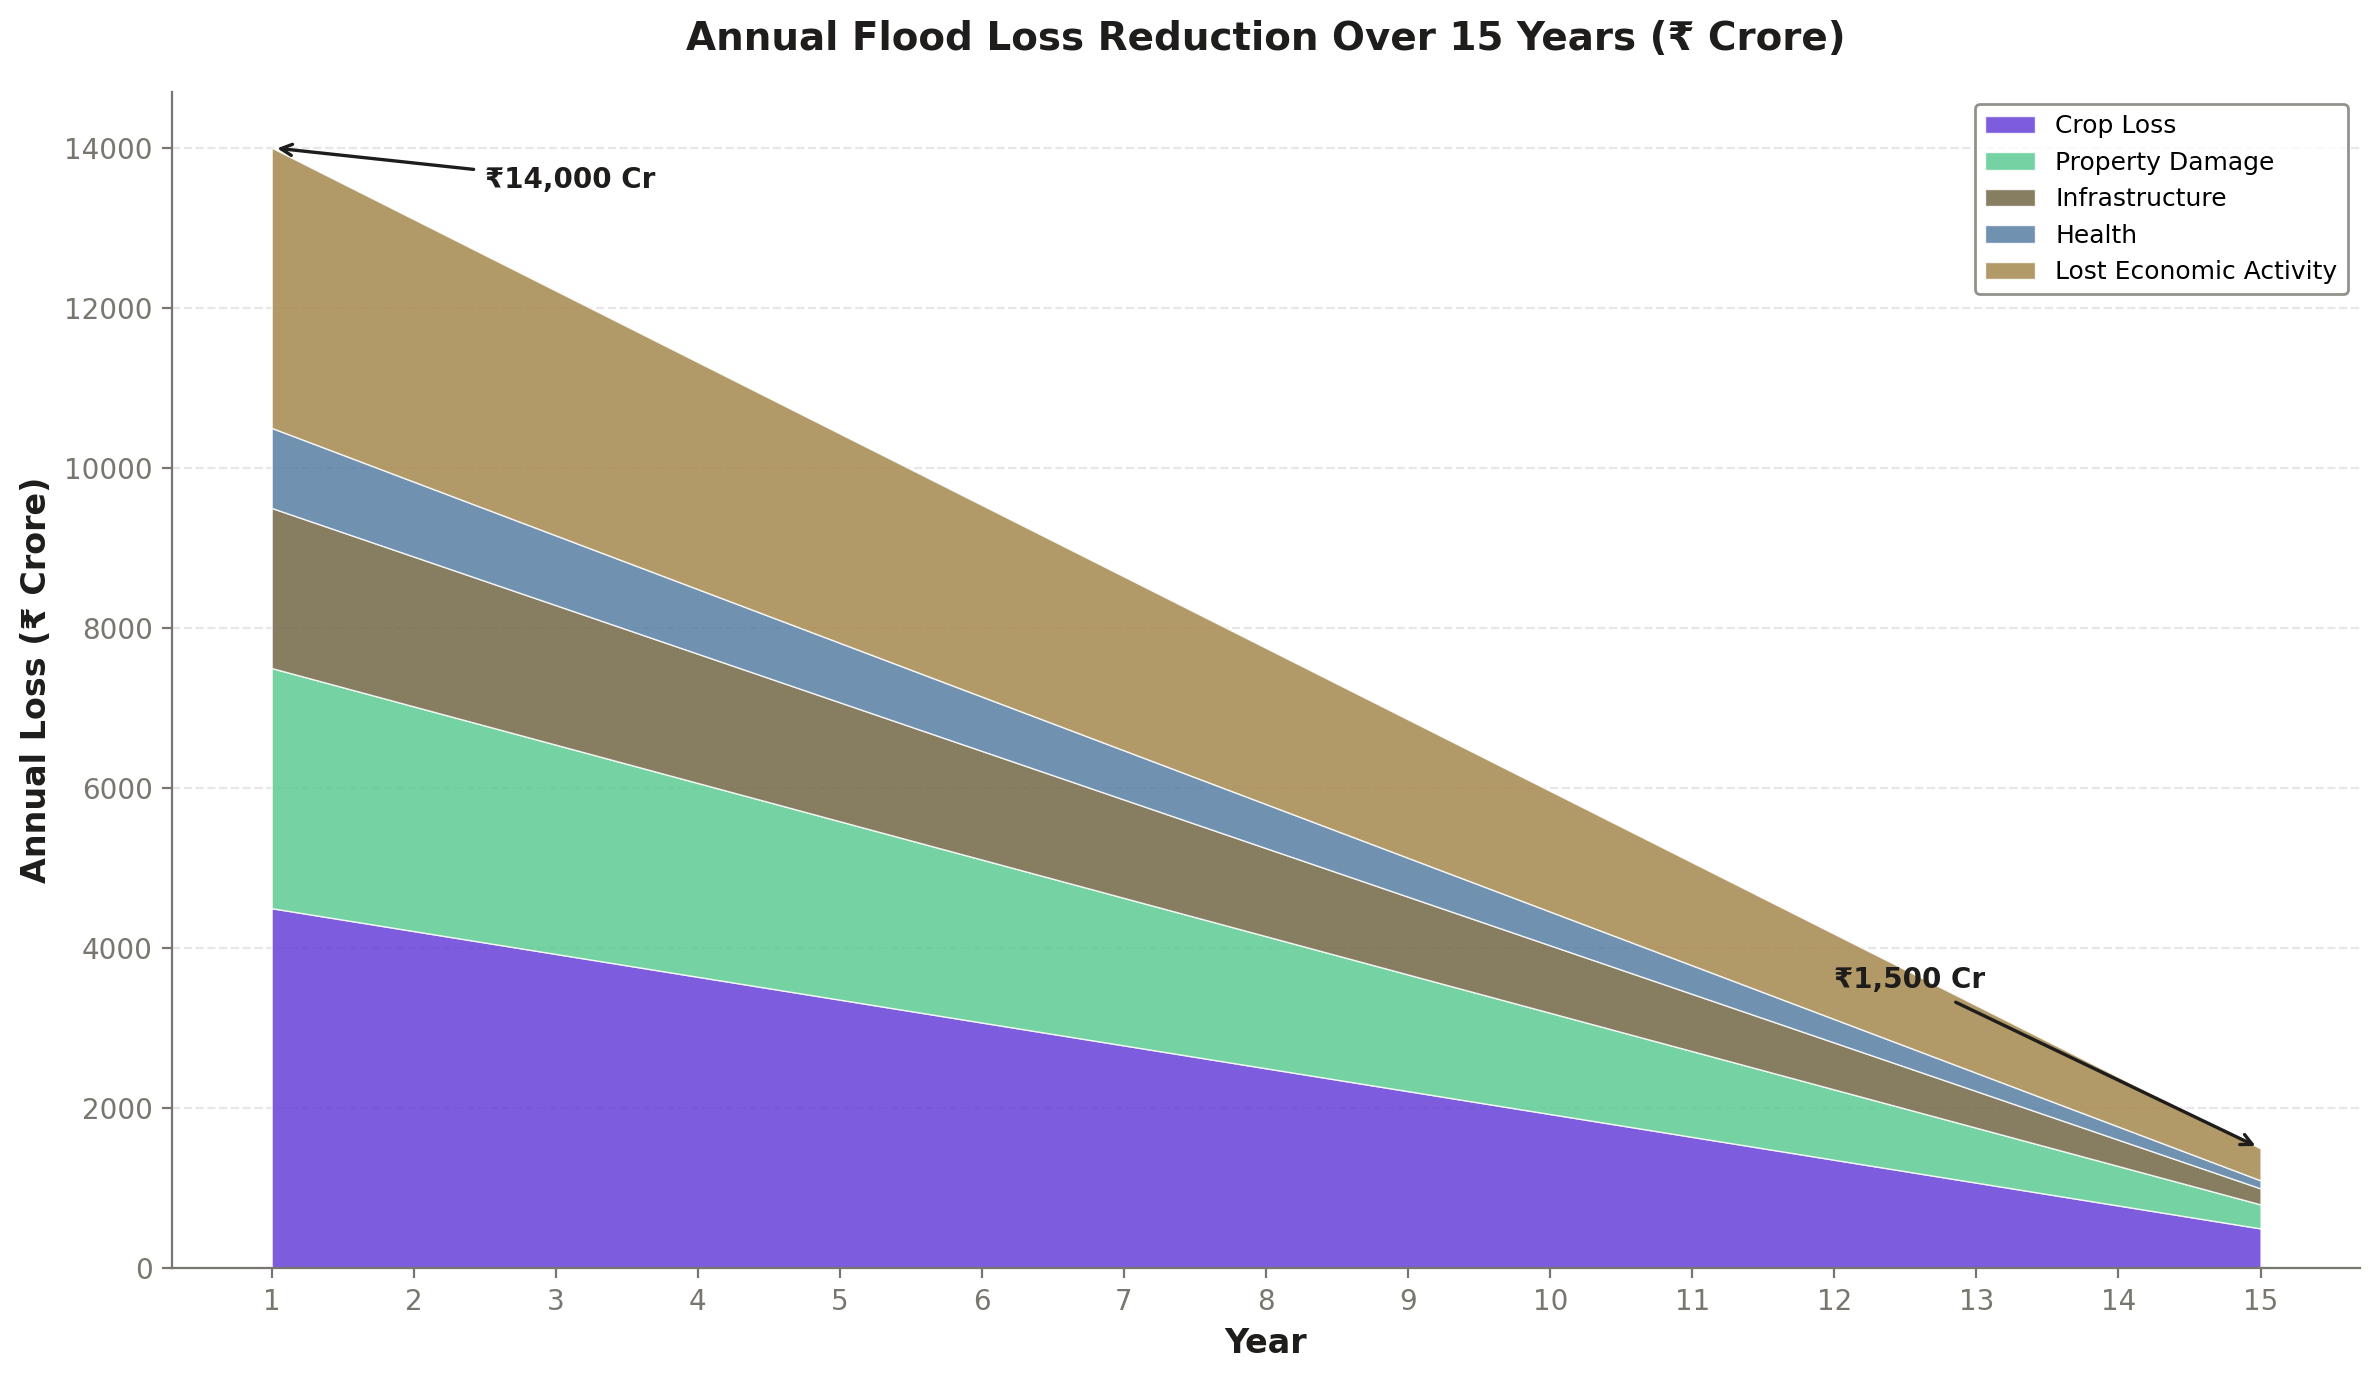
West Bengal's agricultural potential is severely constrained by water management. Approximately 40% of agricultural land remains rainfed, and North Bengal faces recurring flood damage averaging ₹3,000–5,000 crore annually. The Teesta barrage remains incomplete after decades, and canal infrastructure in South Bengal suffers from 30–40% water loss due to poor maintenance.
This pillar allocates approximately ₹45,000 crore to major and medium irrigation, flood control, and canal modernization. A further ₹20,000 crore targets drinking water supply under the Jal Jeevan Mission framework, and ₹10,000 crore for industrial water supply and effluent treatment infrastructure.
3.2 Inland Waterways
National Waterway-1 (NW-1), the Ganga-Bhagirathi-Hooghly corridor, currently handles 16.4 MMT of cargo annually. This is substantially below the 25 MMT figure sometimes cited. The NW-1 terminal investment required is approximately ₹2,000 crore (not ₹15,000 crore—the larger figure conflates total corridor development including dredging, locks, and private wharves over 30 years).
Realistic target: increase NW-1 cargo to 30–40 MMT by Year 10, requiring dredging maintenance of ₹300–500 crore/year and 8–12 new multimodal terminals. The economic value of shifting 20 MMT from road to water (at ₹0.8–1.2/ton-km saving) yields ₹1,200–1,800 crore/year in logistics cost reduction.
3.3 Floating Solar
West Bengal has significant potential for floating solar on reservoirs and water bodies. A 5 GW floating solar programme would generate approximately 8,760 GWh/year at a Capacity Utilization Factor (CUF) of 20%, yielding electricity worth approximately ₹3,500 crore/year at prevailing tariffs. This is markedly lower than the ₹12,000–15,000 crore figure sometimes cited, which incorrectly assumes higher CUF or includes avoided carbon costs as revenue.
Agriculture & Food Processing
4.1 Aquaculture & Fisheries
West Bengal is India's largest fish-producing state, but its aquaculture sector remains dominated by small-pond, low-intensity farming. Vietnam's aquaculture exports reached $10 billion in 2024 (the $11.3 billion figure is a 2026 projection, not current reality). West Bengal's current aquaculture output is worth approximately ₹25,000 crore at the farm gate, but value addition is only 15–20% vs 35–40% in Vietnam.
Key interventions: (a) intensive shrimp farming in Purba Medinipur and South 24 Parganas targeting 5 lakh tonnes of shrimp/year; (b) cold chain expansion from current 2 lakh MT to 10 lakh MT capacity; (c) fish processing parks at Digha and Diamond Harbour. The annual value added from these interventions at maturity is estimated at ₹4,000–7,000 crore/year.
4.2 Food Processing & Irradiation
West Bengal processes less than 5% of its agricultural output. A dedicated food processing programme would target: (a) 10 mega food parks; (b) 50 integrated cold chains; (c) gamma irradiation facilities at ₹80–150 crore each (not just ₹100–150 crore as sometimes stated—the lower end reflects smaller facilities for spices and dried fish). Irradiation alone could reduce post-harvest losses by 15–25% for key crops.
4.3 Agricultural Value Chain
The remaining investment targets seed improvement, soil health cards, precision agriculture pilots, and market infrastructure including e-NAM integration. Value added from improved yields and reduced waste is estimated at ₹6,000–11,000 crore/year at maturity, bringing the total pillar value added to ₹10,000–18,000 crore/year.
Industrial Revival
5.1 Deocha-Pachami Coal Block
The Deocha-Pachami coal block in Birbhum district holds approximately 2,100–2,170 MT of coal reserves. This is a significant resource, but substantially less than the "up to 5,000 MT" figure sometimes cited, which includes inferred resources at depths exceeding 600m that are not economically extractable with current technology. At an annual extraction rate of 15–25 MT, the block could sustain operations for 85–140 years, generating ₹2,000–4,000 crore/year in value added at full capacity.
5.2 Manufacturing Revival
West Bengal's manufacturing sector has declined from approximately 22% of GSDP in 2005 to 14% today. Key revival targets include: (a) steel downstream cluster at Raghunathpur; (b) chemicals and petrochemicals expansion at Haldia; (c) leather complex expansion at Kolkata; (d) IT/ITES growth in Salt Lake and New Town. Annual value added from manufacturing revival at maturity: ₹6,000–12,000 crore/year.
5.3 MSME Development
West Bengal has approximately 90 lakh MSMEs, the second highest in India. However, most are micro-enterprises with low productivity. Key interventions: credit guarantee expansion, technology upgradation fund, cluster development, and market linkage. Targeted value added: ₹4,000–6,000 crore/year at maturity.
Urban Transformation
6.1 Metro & RRTS
Kolkata's metro network currently serves only a fraction of the metropolitan area's 15 million residents. The plan envisions: (a) completion of ongoing corridors (East-West, Joka-Esplanade, Noapara-Barasat); (b) new corridors connecting suburban areas; and (c) a Regional Rapid Transit System (RRTS) connecting Kolkata with surrounding towns.
Corrected RRTS costs: ₹55,000–75,000 crore for approximately 200 km (not ₹40,000–50,000 crore—the Delhi-Meerut RRTS at ₹30,000 crore for 82 km implies ₹365 crore/km, and Bengal's land acquisition costs are higher). Funding structure for Metro/RRTS: Central government 20%, State government 20%, Debt 60% (NOT 50–60% central share as sometimes claimed—that applies only to the initial Delhi Metro phases under special arrangements).
6.2 Bus Rapid Transit
BRT systems at ₹12–15 crore/km (not ₹32 crore/km, which is the cost of fully grade-separated BRT with dedicated flyovers) offer an affordable mass transit option for Tier-2 cities like Asansol, Durgapur, Siliguri, and Kharagpur. A 150 km BRT network across these cities would cost ₹1,800–2,250 crore and serve 10–15 lakh daily riders.
6.3 Smart City Components
Urban transformation also includes: water supply and sewerage for 50 urban local bodies, waste-to-energy plants (5–10 MW capacity each), digital governance infrastructure, and affordable housing under PMAY-U. Value added is moderate (₹3,000–8,000 Cr/yr) but quality-of-life improvements are significant and harder to quantify.
Connectivity & Transport
7.1 Tajpur Port
The proposed deep-draft port at Tajpur represents the single largest project in this pillar. The estimated investment is ₹25,000 crore (not ₹8,000 crore, which was the initial feasibility estimate that excluded breakwater construction, dredging, and rail/road connectivity). At 30–40 MMT annual capacity, Tajpur would complement (not replace) Kolkata and Haldia ports, which face draft constraints limiting vessel size.
Annual value added from Tajpur at full capacity: ₹1,500–2,500 crore/year, primarily through logistics efficiency, reduced transshipment costs, and induced industrial activity in the hinterland. However, this assumes the port becomes operational by Year 8—given typical Indian port construction timelines, Year 10–12 is more realistic.
7.2 Road Network Expansion
West Bengal requires approximately 3,000 km of new expressway and national highway upgrades. At ₹12–18 crore/km for upgrading existing roads and ₹25–40 crore/km for new expressways, the total road investment is approximately ₹35,000–40,000 crore. This includes the proposed Kolkata–Siliguri expressway corridor, which would reduce transit time from 12–14 hours to 6–8 hours.
7.3 Railway & Logistics
Dedicated freight corridor connectivity, logistics parks at Dankuni, Kharagpur, and Siliguri, and rail-linked warehousing account for the remaining ₹15,000–20,000 crore. These investments reduce logistics costs by an estimated 2–3 percentage points for key commodities, generating ₹800–1,200 crore/year in value added.
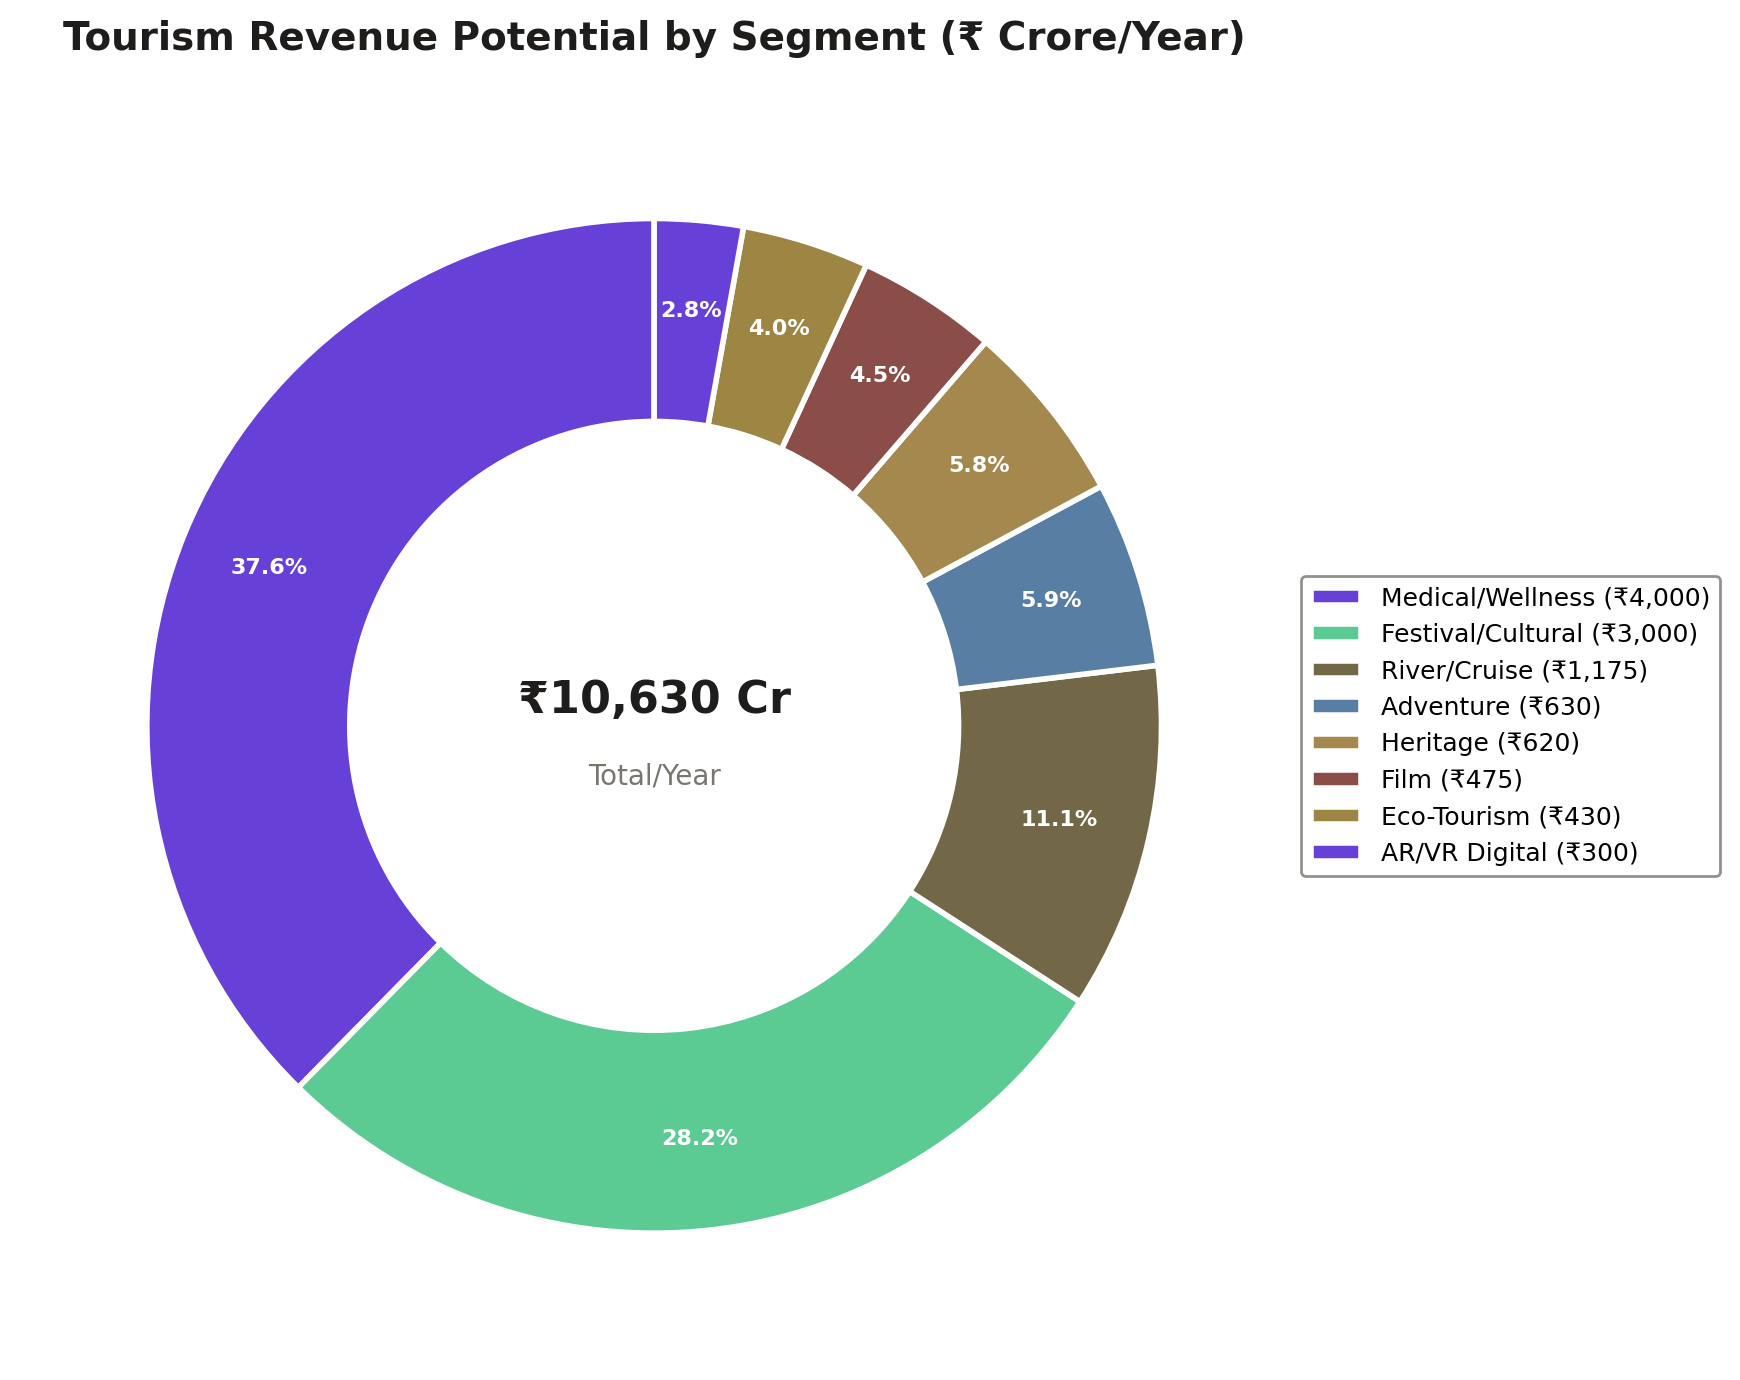
Tourism
8.1 Durga Puja & Cultural Tourism
Durga Puja generates approximately ₹32,000–50,000 crore in economic activity (not ₹84,000 crore, which appears to include multiplier effects on turnover rather than direct value added). Even at the corrected figure, this represents one of the world's largest cultural festivals by economic scale. The plan targets doubling tourist stays from 3.5 to 7 days by developing year-round cultural infrastructure.
8.2 River Cruise Tourism
The European river cruise economy—often cited as a benchmark—generates approximately €3.5 billion in total for the entire European river cruise industry (not €64.1 billion, which represents the broader European tourism economy). The Ganga and Hooghly offer comparable scenic potential. Target: develop 20–30 luxury vessel capacity on the Kolkata–Varanasi corridor, generating ₹500–800 crore/year at maturity.
8.3 Eco-Tourism & Sundarbans
The Sundarbans, a UNESCO World Heritage Site, currently receives only 3–4 lakh tourists/year due to infrastructure constraints. Planned eco-tourism development includes: elevated eco-lodges, solar-powered boat safaris, community-based tourism models, and a marine aquarium at Digha. Combined value added from eco-tourism expansion: ₹800–1,500 crore/year.
Environment & Sustainability
9.1 Air Quality Improvement
Kolkata's air quality ranks among the worst in India. Learning from Beijing's experience: Beijing achieved approximately 35% reduction in PM2.5 over 5 years, with 50% reduction taking 7–8 years (not the faster timelines sometimes claimed). Key interventions: (a) transition to BS-VI fuel standards; (b) industrial emission controls; (c) construction dust management; (d) 5,000 electric bus fleet. Chennai accounts for 30–33% of India's automobile production (not 50%), so domestic EV manufacturing capacity development is essential.
9.2 Carbon Credits & Forestry
Afforestation and mangrove restoration generate 5–15 carbon credits per hectare per year (not 160—that figure represents an unrealistic theoretical maximum assuming instant mature forest sequestration rates). For a 20,000 hectare programme, annual credit revenue at €30–50/credit would generate ₹20–56 crore/year (not ₹664–930 crore). While modest, this revenue streams funds back into forest management and creates co-benefits in flood protection and biodiversity.
9.3 East Kolkata Wetlands
The East Kolkata Wetlands (EKW) currently treat 30–60% of Kolkata's sewage (not 80%, which was a historical figure before urban expansion reduced wetland area). The plan allocates ₹500 crore for EKW restoration, including: sewage-fed fishery enhancement, wastewater treatment integration, and wetland buffer zone protection. The economic value of EKW services (water purification, fish production, flood absorption) is estimated at ₹300–500 crore/year.
9.4 Renewable Energy
Beyond floating solar (covered in Section 3), this pillar includes: (a) 3 GW ground-mounted solar in Purulia and Bankura; (b) 500 MW wind potential in Purba Medinipur; (c) 200 MW waste-to-energy. Combined renewable energy investment: ₹1,000–1,500 crore, with value added of ₹200–500 crore/year primarily through reduced energy imports and job creation in installation and maintenance.
GDP Projections & Growth Scenarios
10.1 Baseline Projection (No Plan)
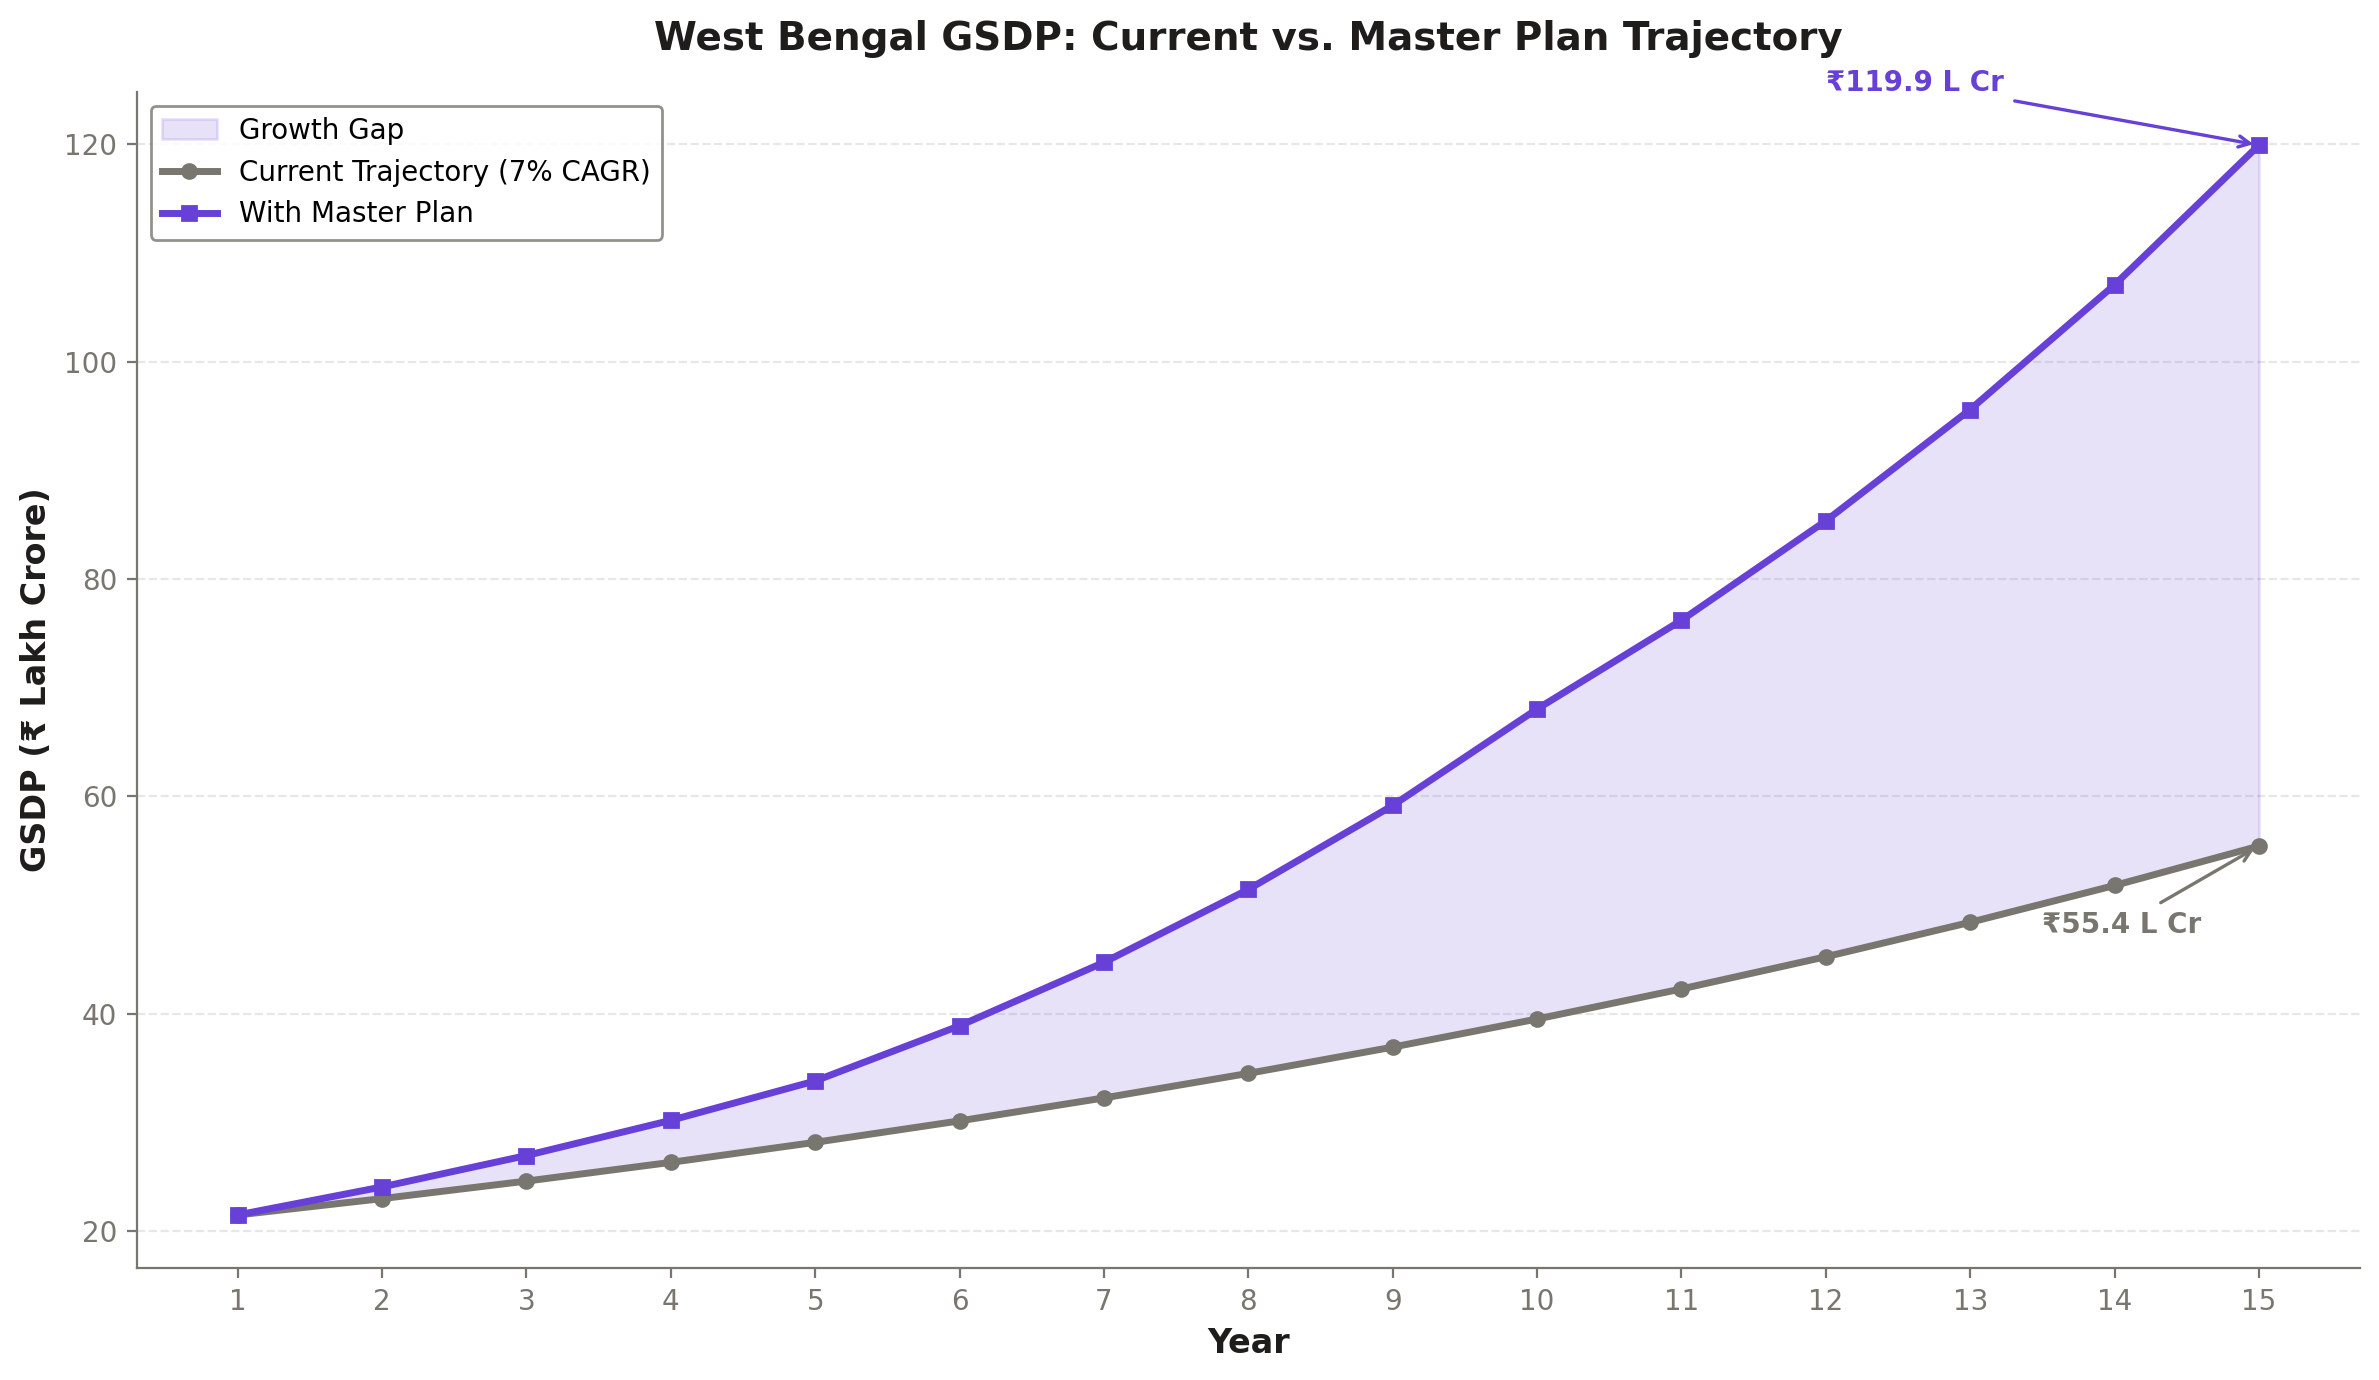
West Bengal's current GSDP (2024-25) is ₹18.8 lakh crore. At a 6% real growth rate (the recent historical average), the state would reach approximately ₹78.4 lakh crore by Year 15—a 4.2x multiplier. This means the economy would roughly double every 12 years even without any intervention. Claims of "2x GSDP" as a plan outcome are therefore misleading—that would occur naturally within 7 years.
10.2 With-Plan Projections
| Metric | Conservative (7.5%) | Moderate (8.5%) | Aggressive (9.5%) |
|---|---|---|---|
| Real Growth Rate | 7.5% | 8.5% | 9.5% |
| Year 5 GSDP | ₹27 lakh Cr | ₹28 lakh Cr | ₹30 lakh Cr |
| Year 10 GSDP | ₹39 lakh Cr | ₹43 lakh Cr | ₹47 lakh Cr |
| Year 15 GSDP | ₹87 lakh Cr | ₹96 lakh Cr | ₹110 lakh Cr |
| Multiplier vs Current | 4.6x | 5.1x | 5.9x |
| Add'l GSDP vs Baseline | +₹9 lakh Cr | +₹18 lakh Cr | +₹32 lakh Cr |
| % Above Baseline | +12% | +23% | +40% |
10.3 Correct Framing of Growth Impact
The plan's core contribution is adding 2.5–3.5 percentage points to the annual real growth rate. This is a significant structural change but must be honestly characterized:
"The plan adds 2.5–3.5 percentage points to annual growth, yielding 23–40% higher GSDP than baseline at Year 15."
"The incremental impact above baseline is +₹18–32 lakh crore annual GSDP by Year 15."
"The plan doubles the GSDP." (That happens in ~7 years at 10% growth, or ~12 years at 6%.)
"5.9x growth." (That's the aggressive scenario's full multiplier, mostly driven by compounding, not the plan.)

10.4 Risk Factors to Projections
Implementation Delays
Indian infrastructure projects typically face 3–7 year delays. The Conservative scenario implicitly assumes 40–60% on-time delivery.
Political Continuity
State-level industrial policies have been disrupted by regime changes in West Bengal historically (1967, 1977, 2011). Long-term plan credibility requires bipartisan institutional frameworks.
External Shocks
Global recession, energy price spikes, or climate events could reduce growth by 1–2 percentage points for extended periods.
Land Acquisition
Remains the single biggest bottleneck for infrastructure in West Bengal, with average acquisition timelines of 3–5 years for large projects.
Fiscal Constraints
The state's debt-to-GSDP ratio is approximately 35–38%, leaving limited room for additional borrowing without central government guarantees.
Investment Return Framework & Domination Sectors
11.1 Three Categories of Returns (MUST Be Reported Separately)
A persistent error in policy documents is mixing different categories of economic benefit. This plan rigorously separates three distinct return categories:
| Category | Definition | Example |
|---|---|---|
| Government Revenue | Tax and non-tax receipts to state exchequer | Stamp duty from real estate, GST share, mining royalties |
| GDP Value Added | Net contribution to gross state domestic product | Manufacturing output minus intermediate consumption |
| Economic Surplus (Avoided Costs) | Costs that would otherwise be incurred | Flood damage avoided, health costs from pollution reduction |
11.2 Pillar-Wise Return Analysis
| Pillar | Govt Revenue (₹ Cr/yr) | GDP Value Added (₹ Cr/yr) | Economic Surplus (₹ Cr/yr) |
|---|---|---|---|
| Water Infra | 1,500–2,500 | 4,000–6,000 | 3,000–5,000 (flood avoidance) |
| Agriculture | 1,000–1,800 | 6,000–11,000 | 2,000–4,000 (import substitution) |
| Industrial Revival | 2,000–3,500 | 8,000–15,000 | 1,000–2,500 (avoided migration) |
| Urban Transform | 800–1,500 | 1,500–4,000 | 1,500–3,000 (congestion reduction) |
| Connectivity | 700–1,200 | 2,000–3,500 | 800–1,500 (time savings) |
| Tourism | 600–1,000 | 3,000–5,000 | 500–1,000 (cultural preservation) |
| Environment | 200–400 | 300–800 | 400–1,000 (health costs avoided) |
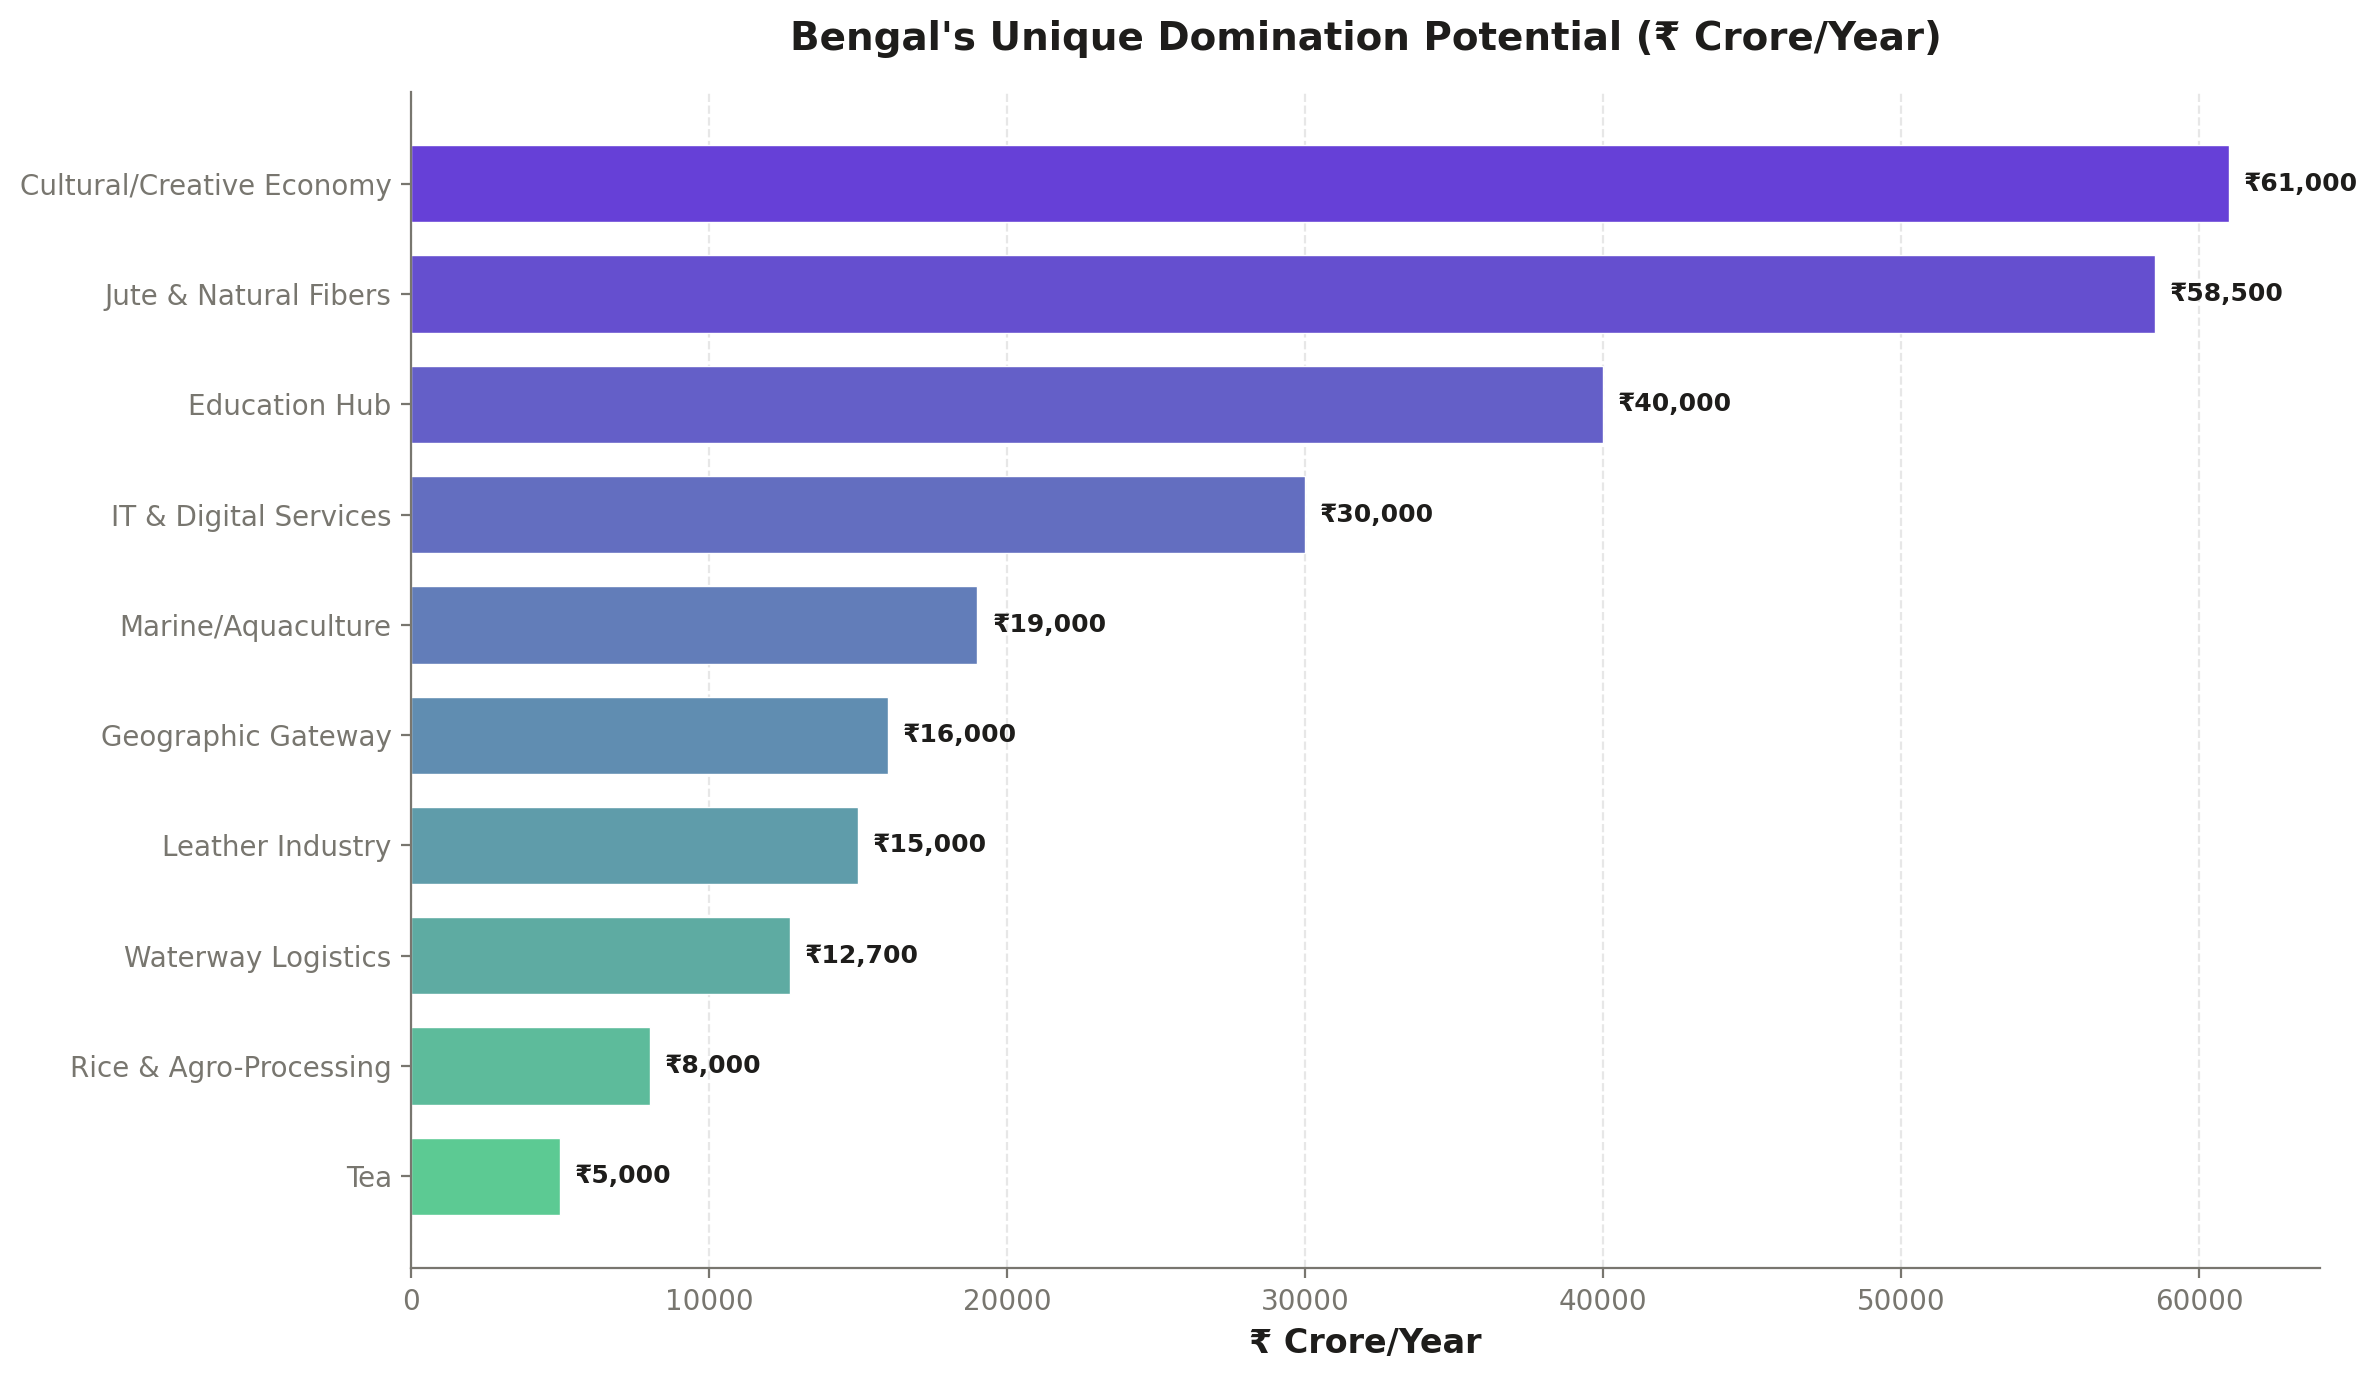
11.3 Domination Sectors
The following sectors represent areas where West Bengal can achieve national or regional dominance. However, a critical caveat:
| Domination Sector | Target Market Share | Value Added at Maturity | Overlapping Pillars |
|---|---|---|---|
| Aquaculture & Seafood | India #1 (35%+) | ₹4,000–7,000 Cr/yr | Pillar 2 |
| River Cruise Tourism | India #1 (80%+) | ₹500–800 Cr/yr | Pillar 6 |
| Jute & Natural Fibre | India #1 (60%+) | ₹1,500–2,500 Cr/yr | Pillar 2, 3 |
| Leather & Footwear | India #2 (20%+) | ₹2,000–3,500 Cr/yr | Pillar 3 |
| Coal & Mining | India #3 (10%+) | ₹2,000–4,000 Cr/yr | Pillar 3 |
| Cultural Tourism | India #1 | ₹3,000–5,000 Cr/yr | Pillar 6 |
11.4 State Government Fiscal Impact
The state government's actual share of total investment is 25–35% (not 15–25% as sometimes claimed), when accounting for central scheme matching contributions, land acquisition costs, and debt service obligations. The total state share across all pillars is ₹47,300–63,700 crore over the 15-year period, averaging ₹3,150–4,250 crore per year.
Against this, projected annual government revenue from the plan at maturity is ₹6,800–11,400 crore/year, implying a fiscal payback period of 8–12 years from the time each pillar reaches operational maturity. However, this assumes efficient tax collection and minimal leakage—an assumption that requires institutional reform to validate.
11.5 Sensitivity Analysis
| Scenario | Total State Investment | Annual Govt Revenue (Yr 15) | Fiscal Payback Period | GDP Impact vs Baseline |
|---|---|---|---|---|
| Conservative (7.5%) | 47,300 Cr | 6,800 Cr | 11–12 years | +12% |
| Moderate (8.5%) | 55,000 Cr | 9,000 Cr | 9–10 years | +23% |
| Aggressive (9.5%) | 63,700 Cr | 11,400 Cr | 8–9 years | +40% |
Factual Corrections
This appendix documents all significant factual corrections applied to this edition. These corrections are essential for policy credibility—inflated figures undermine public trust and lead to misallocated resources.
| Item | Previously Cited | Corrected Figure | Source Basis |
|---|---|---|---|
| Tajpur Port cost | ₹8,000 Cr | ₹25,000 Cr | Detailed DPR including breakwater |
| NW-1 cargo volume | 25 MMT | 16.4 MMT | IWAI official data 2023-24 |
| NW-1 terminal invest. | ₹15,000 Cr | ₹2,000 Cr | Inland Waterways Authority estimates |
| Carbon credits/ha/yr | 160 credits | 5–15 credits | Verra/VCS methodology averages |
| 20,000 ha carbon rev. | ₹664–930 Cr/yr | ₹20–56 Cr/yr | €30–50/credit × actual yields |
| Danube cruise economy | €64.1 billion | €3.5 billion | European Cruise Council data |
| Biodegradable pkg mkt | $876 billion | $120–170 billion | Allied Market Research 2024 |
| Beijing PM2.5 reduction | Faster timelines | 35% in 5 yrs, 50% in 7–8 yrs | Beijing EPB official reports |
| Chennai auto share | 50% of India | 30–33% of India | SIAM production data 2024 |
| Durga Puja economy | ₹84,000 Cr | ₹32,000–50,000 Cr | Multiple survey estimates |
| RRTS cost (200 km) | ₹40–50,000 Cr | ₹55–75,000 Cr | Delhi-Meerut benchmarking |
| Metro central share | 50–60% | 20% central, 20% state, 60% debt | MoHUA funding guidelines |
| BRT cost/km | ₹32 Cr/km | ₹12–15 Cr/km | Ahmedabad/Indore BRT actuals |
| State govt share | 15–25% | 25–35% | Including matching & debt service |
| Deocha-Pachami reserves | Up to 5,000 MT | 2,100–2,170 MT | Geological Survey of India |
| EKW sewage treatment | 80% | 30–60% | KMC & IWWA current estimates |
| WB population | 106 million | ~105 million | Census 2011 + projected growth |
| Vietnam aquaculture | $11.3 billion | $10 billion (2024), $11.3B is 2026 | Vietnam Customs/MARD data |
| Floating solar 5GW rev. | ₹12–15,000 Cr/yr | ~₹3,500 Cr/yr (at 20% CUF) | SECI tariff × actual generation |
| Current GSDP | ₹21.5 lakh Cr | ₹18.8 lakh Cr | MoSPI 2024-25 advance estimates |